


Data visualization and Business intelligence applications are on the rise and trending. These types of applications are not only used by people with a Ph.D. in Data Science but have also now become popular with professionals in different roles. With the vast abundance of data, comes the need for visualization and thus making data a part of your business decision-making. In this article, we'll take a closer look at what Microsoft Power BI is and its benefits.
Microsoft Power BI is an interactive platform that connects applications and software and transforms unrelated data sources into meaningful and eye-catching visualized structures. Hence it becomes easy to share relevant information and to better make sense of your data.
You can present real-time reports of a company’s data via a dashboard or a report. This contributes to reducing the scope of error by giving accurate data to improve decisions about what should happen when and to predict the future.
If you know how to use Microsoft Excel, then working with Microsoft Power BI would not be a problem for you at all. Because they both have the same basis, but Microsoft Power BI possesses great functions that Microsoft Excel does not.
What are the main benefits of Microsoft Power BI?
- User-friendly visualizations and an adaptive platform
- Zero speed and storage restrictions
- Saves your time
- Predicts future of a business
- Non to little coding knowledge
User-friendly visualizations and adaptive platform
You can create personal dashboards and reports with an interactive and understandable visual setup. You're not restricted to visualizations that are already a part of Power BI, but you can use other adaptive visualizations that are available in Office Store or other web pages. Hence, it's a highly customizable platform.
Zero speed and storage restrictions
You will not be hindered by storage capacity limits or speed restrictions since Microsoft Power BI is a total cloud-based system that enables fast recovery and examination.
Saves your time
You don’t need to spend time creating advanced reports. No need to copy and paste from Excel or other applications. Power BI collects and facilitates data so you can solely focus on examining, and communicate graphs, numbers, reports, etc. to your colleagues in seconds.
Predicts future of a business
Let alone analyzing what has happened with the business in the past or the present, Microsoft Power BI possesses the capability of suggesting the immediate future of your business. It analyzes the patterns in the data that exists and based on that foretells what might happen in the future.
Read more: Google Data Studio vs. Microsoft Power BI: A comparative analysis
This is extremely powerful as this warns the company of any coming challenge they might face or error they might be about to make due to its machine learning feature. Power BI may not replace crystal balls or fortune-tellers but it’s a great tool for helping you make business decisions for the future based on current and historical data.
How to use Microsoft Power BI?
Power BI can help you visualize any type of data you are in ownership over. If you already are on the Office 365 platform, you have a wide array of already-in-place connectors that you can start with. If you should have any other data such as financials, you can simply import the dataset in Power BI and start building a report with graphs and charts from the get-go!
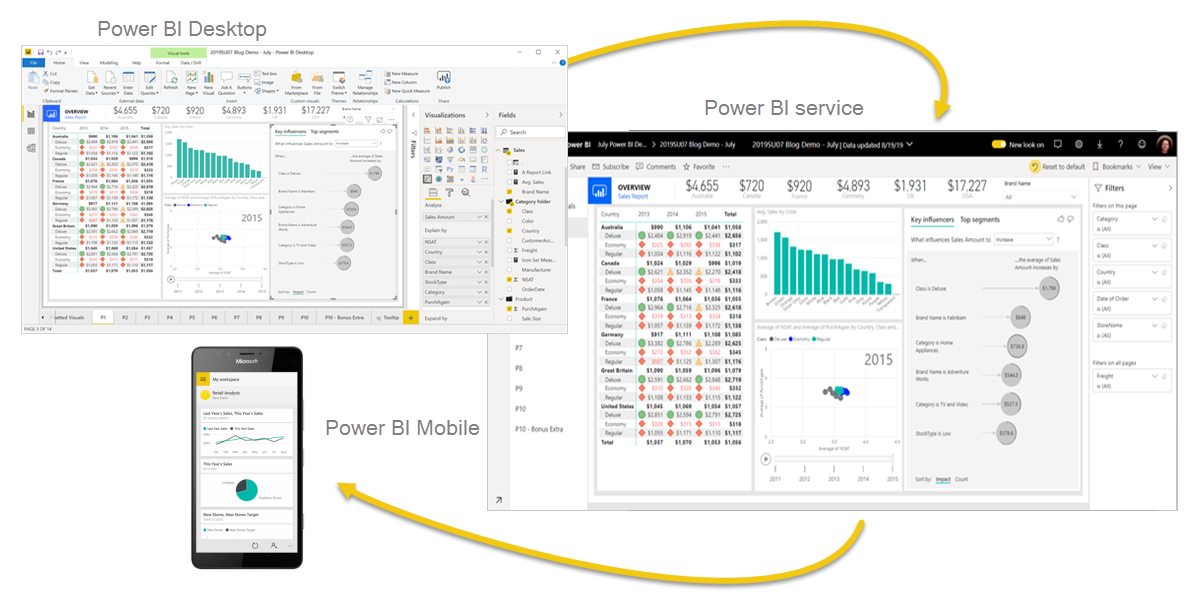
In more detail, Microsoft Power Bi consists primarily of 3 structures:
- Power BI mobile apps, for different mobile devices and operators
- Power Bi desktop, a desktop application for Windows
- Power BI service, which is an online SaaS (Software as a Service)
Moreover, there are 2 other structures, Power BI Report Server, which is a local report server where you publish your reports when you have created them, and Power BI Report Builder, which creates paginated reports so the whole report can be visible on a page.
Read more: How to share Power BI reports in Microsoft Teams
The way an employee uses Microsoft Power BI is dependent on what role he or she has within the company. In any case, you connect different data resources in Power BI Desktop and create a report. Furthermore, you publish the report to Power BI service and share it with colleagues and business partners via email or Microsoft Teams. This way, with any whom the report is shared, through Power BI mobile apps and Power BI service can view and interact with the report.
Conclusion
A platform that lets you share highly customizable eye-catching visual reports from various data sources to your clients, customers, and colleagues in a fast and easy way.
An amazing tool for analyzing the past, present, and future of your business and sharing this information with relevant people.
Easily synchronized and adaptable solution that keeps your numbers and reports updated. And makes it easier for you to focus on what’s important for your business’ progress. Rather than wasting your time to prepare a presentation of reports where you must do the nitty-gritty work of connecting, assembling, and making a proper visual structure that is understandable to people you want to share it with.


.png)