


Much has happened within the data visualization software industry. With the increase of technological development comes an abundance of data to gather, analyze and execute. We have done a comparative analysis of two of the most popular tools in the market, which are Google Data Studio and Microsoft Power BI.
Not that long ago most of us understood that the data visualization concept only existed for upper management people in black suits. Fortunately for many, those times have changed. Now people at every level of the organization can use and leverage the power of data visualization and BI tools to make better business decisions. These tools help professionals and teams build dashboards and reports, set goals, and take advantage of easy-to-use tools without the need for coding skills.
Here are the main benefits of using these tools:
- Tracking and performance measurements
- Data visualization
- Track bottlenecks and manage operations
- Identify patterns and trends
- No coding is necessary
- Design and customization
For this to be effective, you have to identify the right tool for you and your business. Further down this article, we will compare these tools against each other to provide clarity and might help guide you in the right direction.
What is Google Data Studio?
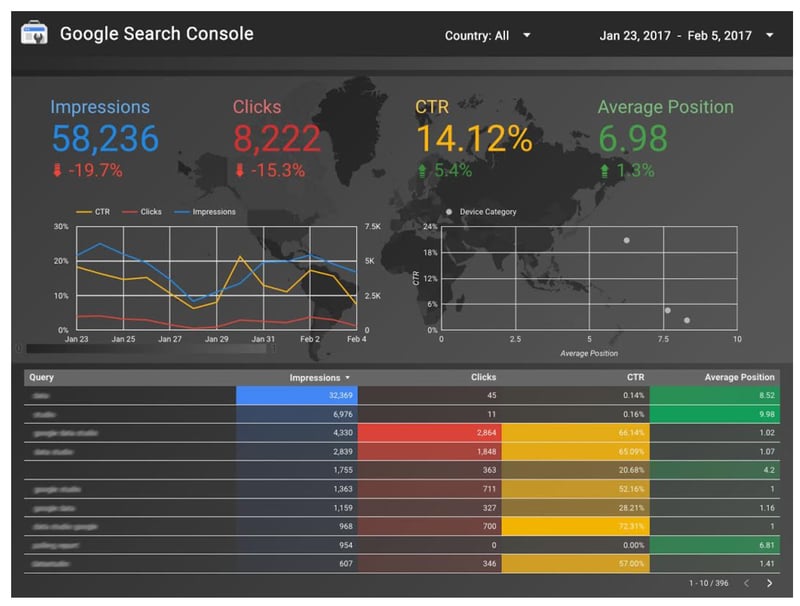
Google Data Studio (GDS) is a great and free data visualization tool. Google Data Studio lets you build fantastic interactive and customized dashboards for modern reporting. It tightly integrates with Google-based data sources like Google Ads, Google BigQuery, and Google Analytics.
Google Data Studio uses the well-known Google's intuitive interface, and it´s aimed at giving non-technical users the ability to visualize their data. At this current moment, they offer access from around 800+ data sets from over 440 connectors. Within an instant, you can connect data sources to Google Data Studio, and start generating charts and tables. You can build interactive reports and share them with your team, clients, or stakeholders.
Read more: A more detailed description of what Google Data Studio is
What is Power BI?
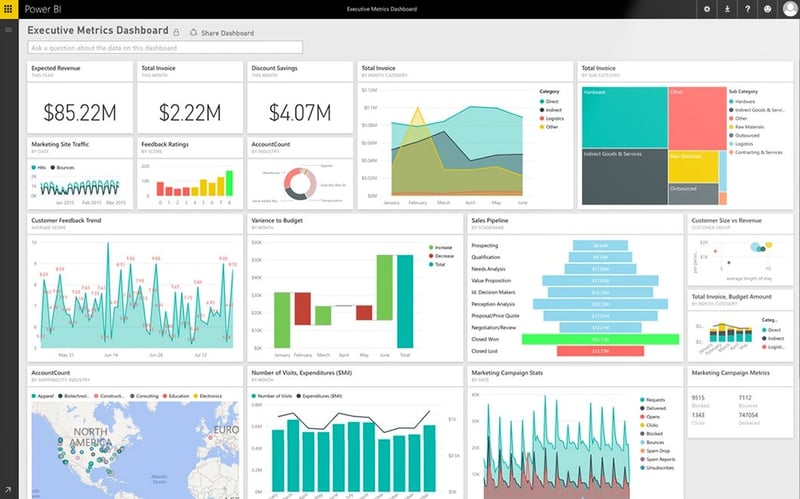
Power BI is a cloud-based analytics software developed by Microsoft. It is very popular in the BI market, and it´s also very powerful. Like with any Business Intelligence tool, Power BI is used to generate interactive, appealing reports and dashboards to share your data story.
With Power BI you can connect any data using the unified, scalable platform for self-service that is easy to use and helps gain deeper data insight. Power BI connects to both on-premises and cloud-based sources, and you can either import or upload your files for transformation and analysis. You can mix up this data, model it, and build schemas. Power BI has components such as Power Query for data transformation, Power Pivot for tabular data modeling, Power View for visualization, and much more.
Google Data Studio vs. Power BI
Both Google Data Studio and Power BI are some of the leading tools based but Power BI edges out Google Data Studio based on the Gartner, Magic Quadrant for Analytics and Business Intelligence Platforms. To find the solution that´s best suited to your business, we have identified a couple of features that you must consider.
Data Sources and connectors
Google Data Studio integrates with other Google products such as Google Analytics, Ads, BigQuery, Sheets, 360 suits, etc. But it does not natively support many other cloud-based sources. Google allows its partners to develop connectors, but these are mainly paid features. If your business is using Google Workspace (formally Google G-Suite), the allocation and connection to data sources is a fast ordeal.
Power BI has integrations with Microsoft products such as Azure, Office 365 with such as SharePoint, Office, etc. Along with marketing applications such as Google Analytics, Salesforce, Zendesk, Hubspot, Intercom, and several others. You can also connect to databases, CSV files, etc. You can also scrape data from a webpage. If you have data from one or many sources, Power BI will do the job.
Interface and ease of use
Data Studio is very easy to navigate, and the learning curve is minimal but worth mentioning if you already have experience with Google´s product portfolio. The interface is very intuitive, and if you have clean data, all you need to do is drag-and-drop to create a great-looking dashboard quickly. Connecting to your data sources or connectors is a quick and straightforward task. Just choose the desired data source, and with a few clicks, and you're done.
In more detail, you can use pre-filled themes or create a custom theme based on your preferences and branding. You can also add images instead of colors which lets you flex your creative muscles. You can add a wide array of pie, line, and bar charts. In addition, you can also structure page layout, size, alignment as well as conditional formatting.
For Power BI, if you are comfortable with Excel, you might get an easy start with the tool. It might take a bit of a struggle for the novice to connect and integrate with your sources since it´s not as simple as Google Data Studio. Power BI also has more functionalities than Google Data Studio. Still, Power BI lets you create reports easily with its drag-and-drop feature.
When it comes to design and formatting, you have an abundance of design possibilities to make your report a great-looking one. With Power BI you have the opportunity to flex your creative muscles to the point that you can almost do anything, but of course, within reason.
The transformation of data
When it comes to data transformation, Google Data Studio is behind Power BI in this regard. The only real data transformation you can do is via the JOIN key, which is a set of fields that identify the records to include in a blended data source. Data Studio assumes that you have clean data that is ready for visualization. For people and companies that don't have a lot of data, cleaning it is not as big a task as thought to be.
Unfortunately, data is rarely available in the format you need it in. Cleaning and transforming data is an important part of the analysis. Power BI has the features of Power Query, which is a data connection technology that lets you clean your data. It´s an ETL (Extract, transform, load) tool that you can connect to several types of data.
You can also use Data Analysis Expressions (DAX) to build formulas and expressions. Power BI can perform a lot of complex data transformations. But this is where things can become complicated for beginners. Without the foundational knowledge of M-language and Excel VBA, it will be hard to get ahead.
Installation
When it comes to installation, both tools have a bit different approach. For Power BI, there are three types of versions available. Microsoft offers Power BI Desktop, Power BI Pro, and Power BI Premium. Power BI Desktop is the free version of Power BI that can be installed on your desktop. Power BI Pro and Premium are paid versions.
Google Data Studio is cloud-based. It is a browser-based tool, and all you need is a Google account, PC, and network access, and you are good to go.
Sharing
Sharing your dashboards and reports is a very important feature. Stakeholders and colleagues have the ability to view, analyze and make relevant data-driven business solutions.
Power BI reports can be shared with others with a paid Power BI account. With the share feature in Power BI, you can share reports via email, link, or via Microsoft Teams, both inside and outside your organization.
Read more: How to share Power BI reports in Microsoft Teams
In Google Data Studio you can share your reports via a link with set privileges or through email with anyone. You can also download it as a PDF or preview embed the report in another existing solution that you are using.
Pricing
A huge benefit of Google Data Studio is that it's free! All you need is a Google account, either a personal or business account.
Power BI Desktop is also free, but that might be useful for beginners who want to get started with data visualization. For business purposes, when you need to share your dashboards, you will incur $9.99 per user, per month for Power BI Pro. Power BI Pro is a cloud-based BI, that can be used for collaboration, publishing, sharing, etc.
If you need cloud and on-premises reporting, support for big data and advanced analytics, dedicated cloud computing, and storage resources, take a look at the Power BI pricing page.
Final words
In conclusion, if you are already present on Google Workspace and already using solutions such as Youtube Analytics and Google Analytics, your best option would be Google Data Studio. With Google Data Studio, there is no need for complex data transformation, with hassle-free installation and upstart. Also, this Google Data Studio is a perfect tool for those of us who are not data scientists or data professionals.
On the other hand, if you have a wider variety of data sources and you need a BI tool that has great data transformation capabilities, customization options and you don't mind paying, then you should consider Power BI. Bear in mind that, since it is more powerful and robust, you also need to face the steeper learning curve, especially if you are not an avid Excel user.
All in all, both tools are great but have different capabilities and different learning curves. We can say that Microsoft Power BI requires more technical knowledge and understanding, and professionals that are used to working with data. Google Data Studio is more meant for marketers and others that need to visualize data and generate a report either for internal use or share with clients. I hope that this article has been helpful and recommend trying both solutions to see which one you are comfortable with.


.png)